Community Consultation Comparison Report
Objective: Gain an understanding of the Community Consultation Comparison report
The Community Consultation report provides:
- An explanation on how changes in Levels of service relates to the value of asset stock
- Comparison of the rate increase/decrease in providing a certain Level of Service, so the community knows what it means in terms of cost if they want a better service
- Provide a description of how technical Levels of Services (defined in terms of service criteria) translates back to customer satisfaction
To view the Community Consultation Comparision:
- Select Community Consultation Comparison Report from the drop down menu of the report viewer
- Select the simulation setups to compare
- Click View Report
The following screen will appear:
User Define Values:
Total Replacement Value of the Stock
This is the total replacement value of all assets in the portfolio (data set)
Number of Rateable Properties
This is the number of rateable properties of a council or customers of an agency who will be paying for the service.
Service Index/Asset Stock Value/Community Satisfaction
This is the value of Asset Stock. As an asset ages, if appropriate maintenance and timely capital renewals/upgrades and expansion funding are not injected the level of service intended to be provided by the asset starts to decline, and as a result the value of the asset will also gradually diminish.
As the asset stock value and level of service it provides begin to degrade, community satisfaction of the service that asset provides also starts to decline. Agencies are expected to possess a good knowledge on the correlation of levels of service, asset stock value and community satisfaction, which are agency specific. The percentages can be manually configure for Asset Stock value and Community Approval, or the defaults can be used.
- Input total replacement value of the asset stock and number of rateable properties
- If Users possess knowledge on correlation among service level index (in most cases this will OCI or it can be a defined service index), asset stock value and community satisfaction input those figures in the User defined section
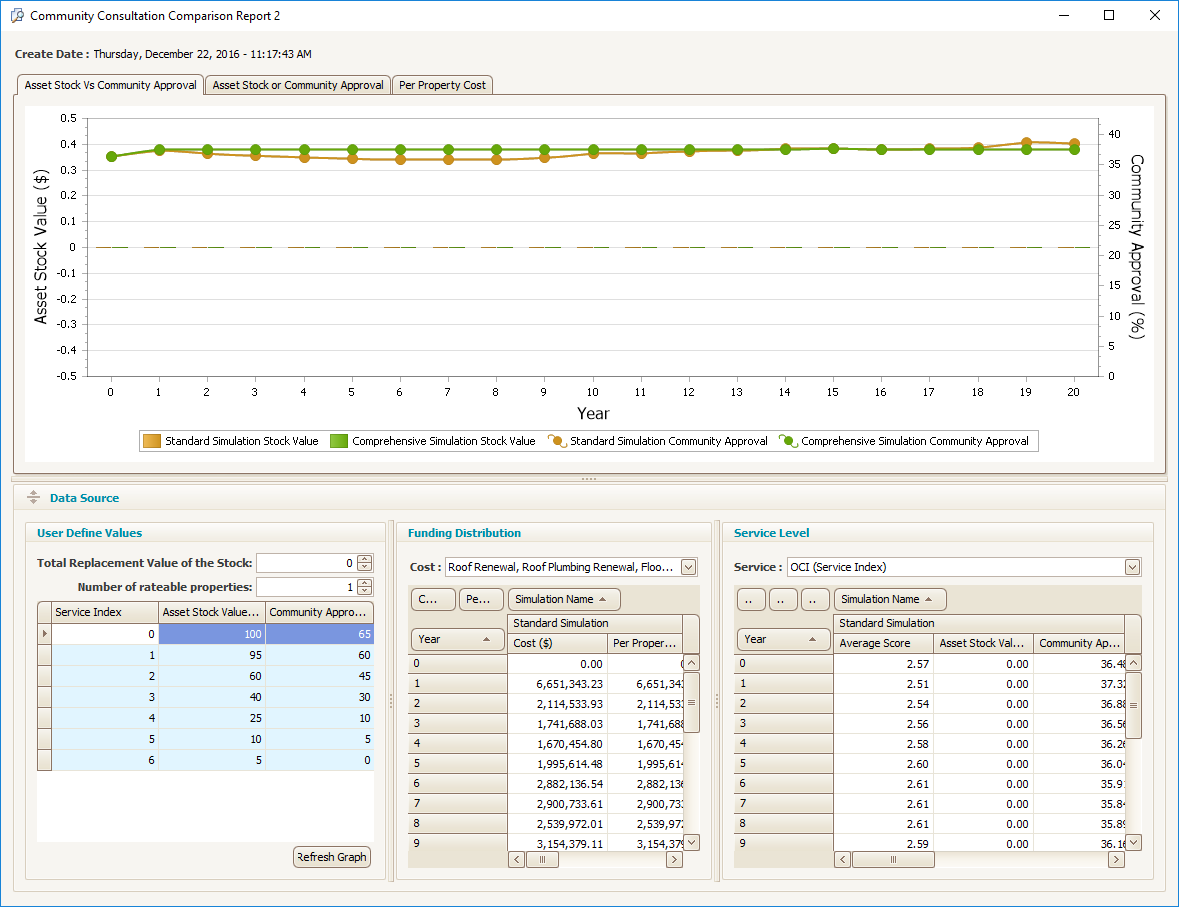
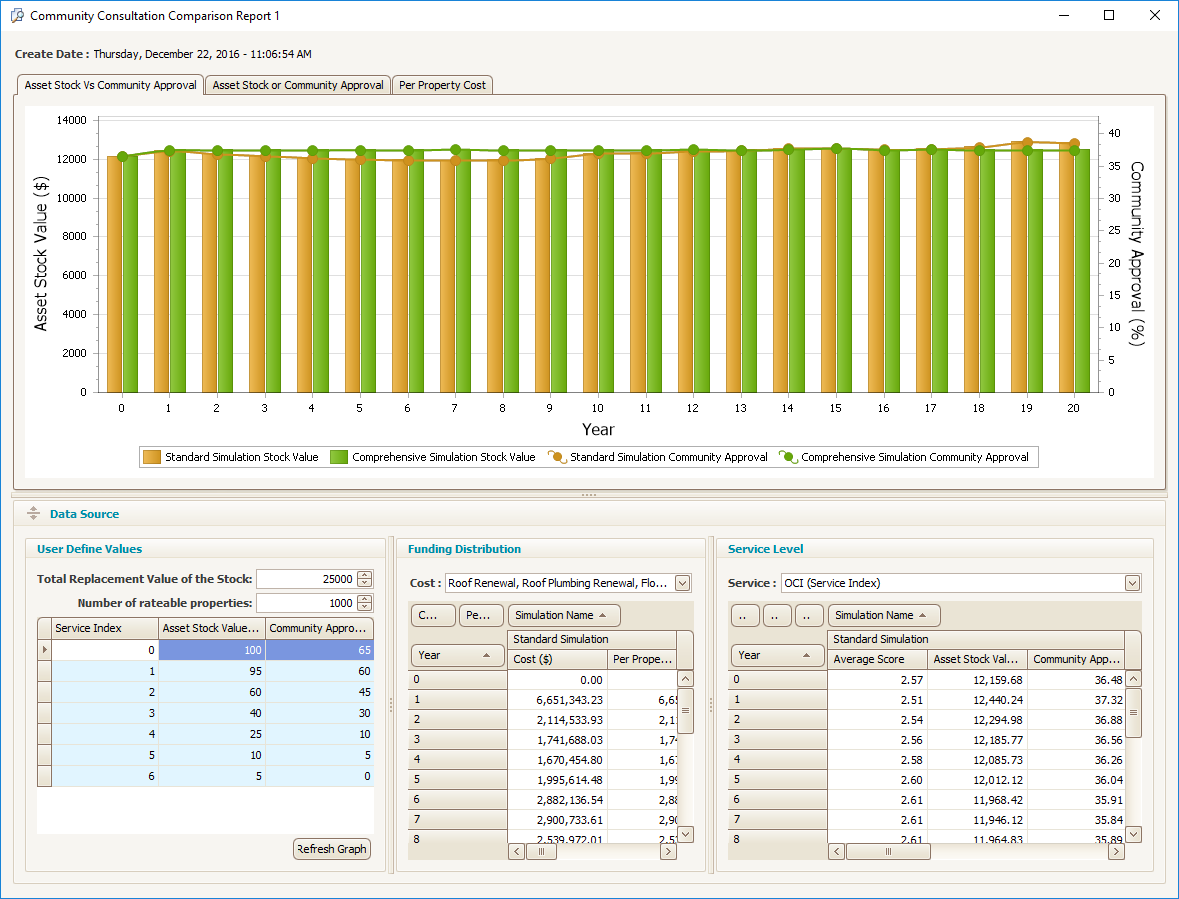
Asset Stock versus Community Approval Report
This graph shows the relationship between asset Stock Value and Community approval rating:
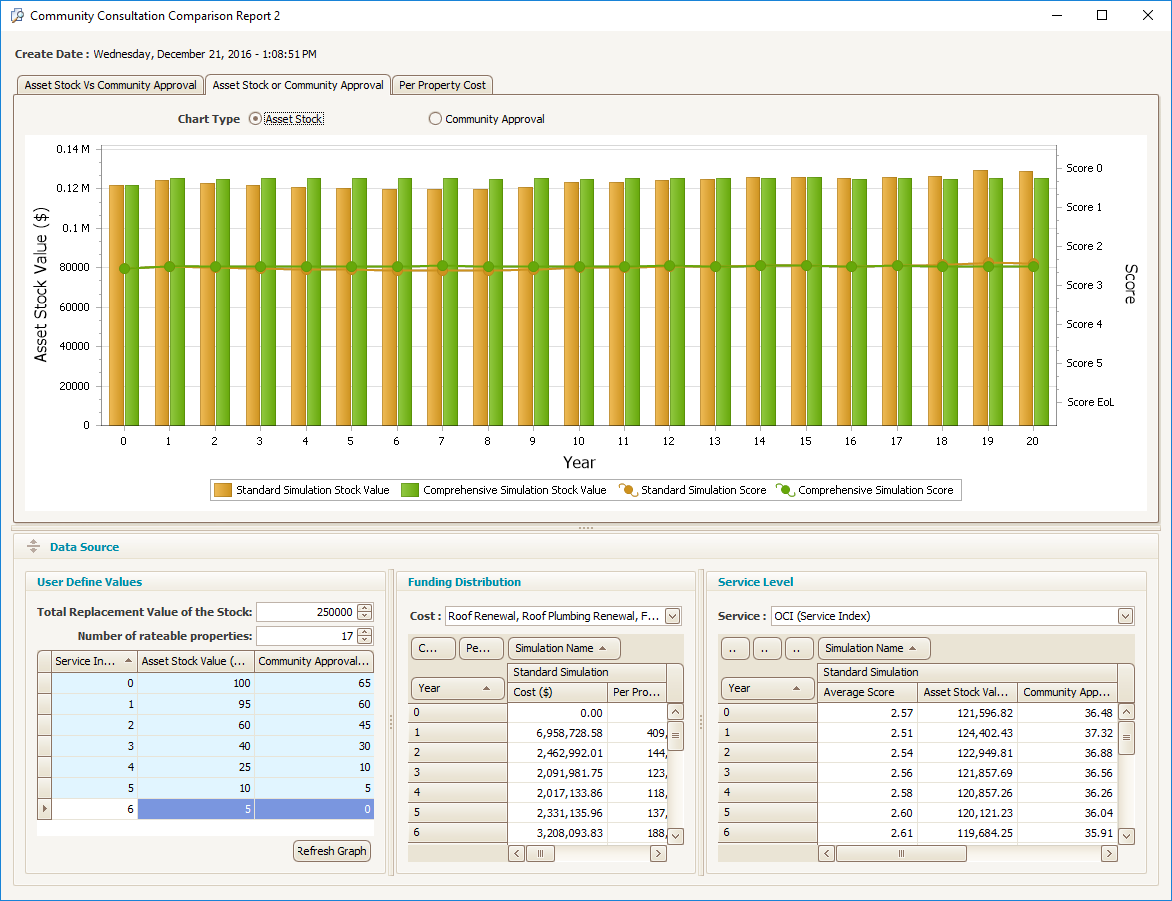
Asset Stock or Community approval report
This graph shows the relationship of asset stock value with Service score (by default). Clicking community approval on top of the graph shows the relationship of community approval versus service score.
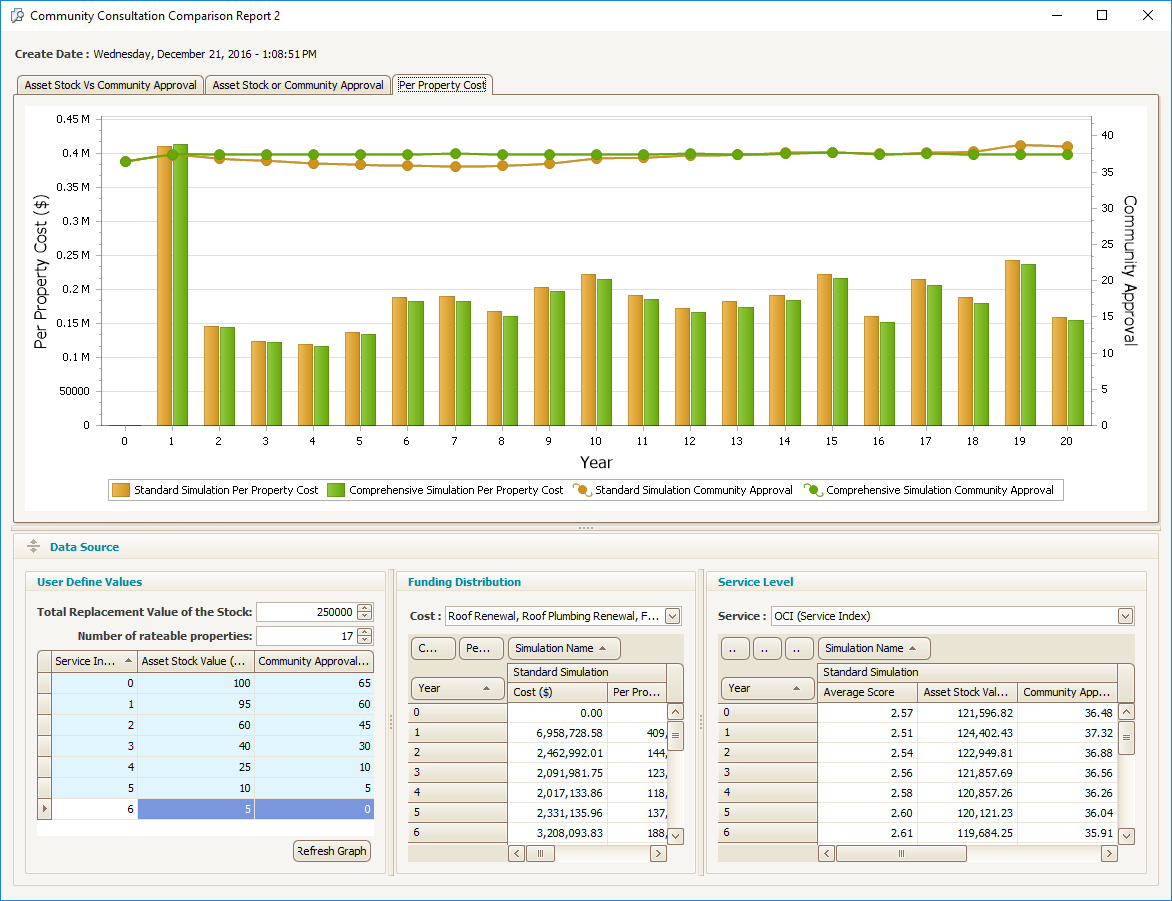
Per Property Cost
This graph provides the relationship of per property cost versus community approval.